I'll bet Mick Jagger never thought that his lyrics about old habits that die hard will ever be used in the field of genome architecture,
but he was right, old habits do die hard and old theories may never pass away. Take for example the oracle abilities ascribed to
the third-codon nucleotides of genes (GC3). The GC content (GC%) of these nucleotides, which can be fewer than 100 base pairs (bp),
were believed to predict the GC content of very long stretches of DNA, named isochores (>300 kilo bases).
What dark force bewitched the scientific community to believe in these relationships for over 20 years? To answer this question we will go
back in time to when Bernardi and his colleauges (1985) described the genome of warm-blooded vertebrates for the first time,
using shredded DNA fragments. The term "isochores" was introduced earlier (Cuny et al. 1981); however,
the 1985 Science publication made it popular. The description was incorrect, but that is outside the point.
Although the 1985 paper is often cited in regard to GC3, it only states that GC3 is expected to differ for heavy and light exons.
This finding was not very exciting and it was not further discussed in the paper, or so we were led to think...
Only two years later, Bernardi informed us that we must have read the wrong paper because the 1985 findings clearly stated that:
"The GC levels... of codon third positions show a linear dependence upon the GC levels of the genome compartments harboring the sequences"
(Mouchiroud, Fichant, and Bernardi 1987). The troubled reader may dig into the figures and tables looking for evidence but will end up
disappointed because there is none. In the conclusions, however, our troubled reader would realize again that the papers in Bernardi's
dimensions depict results beyond the comprehension of people in our ordinary dimension: "The linear relationships found between the
GC levels of coding sequences and codon third positions and those of the genome compartments harboring them suggest that the
compositional distribution of coding sequences and codon third positions should reflect that of genome compartments."
I have a feeling we're not in Kansas anymore.
Tracking Bernardi's work later on would fill our mouth with the bitter taste of defeat.
In a later paper Bernardi makes only a minor attempt to justify the now, well established, axiom (Bernardi 1993):
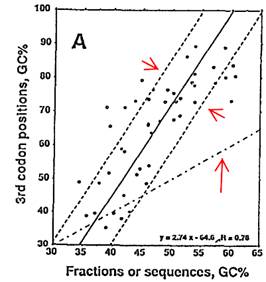
"The compositional correlation that links GC levels of third codon positions of human genes with the GC levels of the extended sequences
in which the genes are located (fig. 4A) can be used to assess gene distribution in the different isochore families and to quantify the finding
(Bemardi et al. 1985) that gene distribution in the human genome is strikingly nonuniform."
It doesn't matter that Figure 4a (right) does not show any clear-cut correlation we were led to believe existed,
but rather a confusing graph in which most of the points distribute around some least-squared fit line (in solid).
Bernardi never mentioned how long the flanking sequences are; they are as long as you'd want them to be.
Our quest ends two years later in the 4th-of-July of isochores with Bernardi's declaration of independence that set off this new trend (1995):
"The compositional correlations between GC3, especially of GC-rich genes... and of the isochores hosting the corresponding genes
indicate the existence of similar constraints in the latter, even if the degree of the constraint is different..."
The cautious reader may stare at Figure 3 that shows a scattered relationship between GC3 and some 500bp flanking sequences as long as he
or she wishes. Bernardi knows that these short flanking regions cannot stand for isochores, just as well as we do. This experiment was only a
mild demonstration of what was already stated to be true. Don't you remember the previous 1987 and 1993 papers?
For the next two decades, the GC content of the third codon-position would be used extensively as the primary means to predict isochore structure,
even after full genome sequences were made available. Real sequences never matched the GC3 amazing predictions so they were politely ignored.
Like a magic eight-ball, GC3 was used to justify any result predicted by the authors. My advisor would say to that
"why bother doing the experiment if you already know the answer, just write down the results and save us both time!"
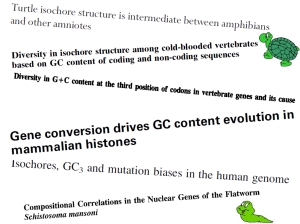
We counted over two dozen papers describing any known genome on earth with at least some of its genes known, from flatworm
(Musto, Rodriguez-Maseda, and Alvarez 1995) to turtle (Chojnowski and Braun 2008) solely based on the gene GC3 content.
There are probably many more papers that used this presumed relationship to produce predictions and explanations for the natural phenomena
they described. Isn't that what science is there for? The scratched disk played the same tune over and over again, yet no one grew weary of it.
Well almost no one.
In 2009 we tested for the first time whether GC3 can predict the GC% of flanking regions around the genes of six species using three
comprehensive analyses (Elhaik, Landan, and Graur 2009).
On the right: Coefficients of determination (r2) between GC1 (green), GC2 (turquoise), GC3 (blue), and GC% (black), on
the one hand, and GCf in 5-kb windows upstream and downstream of the gene, on the other. Calculations were carried (a) for all genes and (b) for genes
that their 200-kb flanking regions do not overlap with other 200-kb flanking regions or with other genes. The number of genes is noted.
The results were shocking! GC3 had no prediction power for the GC content of
flanking regions what so ever!
The magic eight-ball was cracked for the first time.
As many before us, we also got cocky and sent our manuscript to the lion's den, the "Journal of Molecular Evolution" journal
who's former Editors-in-Chief was no other than Bernardi.
As expected, the associate editor assigned to the manuscript was the one listed in the "reviewer I don't want anywhere near my manuscript!" list we provided with the paper, as requested by the journal.
Our hubris caused us a delay in publication, but eventually we published the paper in Molecular Biology and Evolution.
Our conclusions were soon extended to plant genomes by Tatarinova et al. (2010).
We started by saying that old habits die hard, and we claimed that the same applied to theories. A recent study published in "Genome Research"
described the GC-content dynamics across 33 mammalian genomes (Romiguier et al. 2010). Where did they get the full genome of 33 mammals? You guessed correctly,
they used GC3. But did you guess that the corresponding author was Dr. Galtier? A surprising response to our paper awaited us in the last
paragraph of the discussion (clearly, a late addition forced by a careful reviewer).
"In this study, as in many previous ones, GC3 was taken as a proxy for genomic GC-content, a strategy that was recently criticized by
Elhaik et al.(2009). Analyzing the non-coding, flanking regions of the 1138 genes of this study, we found a significant correlation between
GC3 and flanking GC-content across genes, and similar evolutionary dynamics for the two datasets. Elhaik et al. (2009)
compared GC3 with the GC-content of a noncoding window gradually moving away from the focal gene. We suggest that the rapid decline
in correlation coefficient they reported reflects the heterogeneous nature (especially) of GC-rich regions at the 5 kb scale (IHGSC 2001)."
In other words: yes, someone said that the magic eight-ball doesn't work... but ha, we didn't like it so we ignored it.
Although completely unnecessary, we did a small test, but it's available only to people in our special dimension.
In respond to the reviewer's request to "Explain the rapid decay described by Elhaik et al. (2009),
" we'll just make up some Jibberish and cite the human draft paper that ought to make it sound real. Don't bother to check it - it's not there,
not in our ordinary-people dimension, anyway. All our attempts to get the data used in the study failed.
And so we reached the end of our quest. Will the scientific community continue using the GC3 as a proxy for isochores? We hope not.
Today, we have well established algorithms that can accurately detect compositional regions in the genome (Elhaik et al. 2010).
Alas, these algorithms only work if one has the complete genomic sequence (sorry, no magic eight-balls are used in our papers).
Therefore, the real question is whether scientists will be patient enough to wait for the complete genomes before predicting their structure.
I hope they will.
References
Bernardi, G. 1993. The vertebrate genome: isochores and evolution. Molecular Biology and Evolution. 10:186-204.
Bernardi, G. 1995. The human genome: organization and evolutionary history. Annual Review of Genetics. 29:445-476.
Bernardi, G., B. Olofsson, J. Filipski, M. Zerial, J. Salinas, G. Cuny, M. Meunier-Rotival, and F. Rodier. 1985. The mosaic genome of warm-blooded vertebrates. Science. 228:953-958.
Chojnowski, J. L., and E. L. Braun. 2008. Turtle isochore structure is intermediate between amphibians and other amniotes. Integr. Comp. Biol. 48:454-462.
Cuny, G., P. Soriano, G. Macaya, and G. Bernardi. 1981. The major components of the mouse and human genomes: Preparation, basic properties and compositional heterogeneity. European Journal of Biochemistry. 115:227-233.
Elhaik, E., D. Graur, K. Josic, and G. Landan. 2010. Identifying compositionally homogeneous and nonhomogeneous domains within the human genome using a novel segmentation algorithm. Nucl. Acids Res.:gkq532.
Elhaik, E., G. Landan, and D. Graur. 2009. Can GC Content at Third-Codon Positions Be Used as a Proxy for Isochore Composition? Molecular Biology and Evolution. 26:1829-1833.
Mouchiroud, D., G. Fichant, and G. Bernardi. 1987. Compositional compartmentalization and gene composition in the genome of vertebrates. Journal of Molecular Evolution. 26:198-204.
Musto, H., H. Rodriguez-Maseda, and F. Alvarez. 1995. Compositional correlations in the nuclear genes of the flatworm Schistosoma mansoni. Journal of Molecular Evolution. 40:343-346.
Romiguier, J., V. Ranwez, E. J. Douzery, and N. Galtier. 2010. Contrasting GC-content dynamics across 33 mammalian genomes: Relationship with life-history traits and chromosome sizes. Genome Research.
Tatarinova, T. V., N. N. Alexandrov, J. B. Bouck, and K. A. Feldmann. 2010. GC3 biology in corn, rice, sorghum and other grasses. BMC Genomics. 11:308.
 From Bemardi et al. (1985)

From Elhaik et al. (2009).
 From Romiguier et al. (2010).